

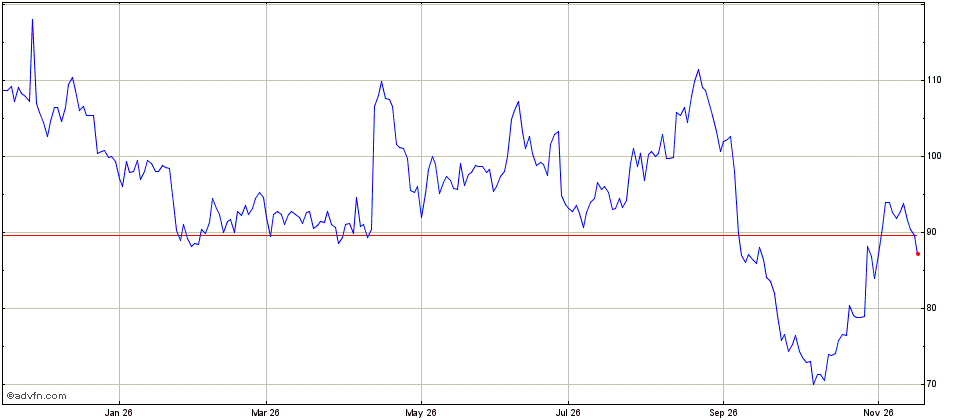
The Rank Group plc share price refers here to the company’s ordinary shares traded in London under RNK. We distinguish the quoted unit, price field and market timestamp before comparing numbers. Share capital and dividend information have their own dates and should be read separately from a changing market price.

RNK share price and chart
The chart above follows Rank’s London ordinary shares in GBX. ADVFN supplies intraday, one-month and one-year chart images. A separate reference shows the closing price verified for 16 November 2026, with its source and trading date; it is not a streaming quotation. When a provider image cannot load, a locally saved chart remains visible with its capture date. Saved charts do not update themselves.
A quote describes a particular market observation; a chart places observations in a selected period. Their instrument, units and timing need to agree. An intraday trade, a daily closing price and a longer-term performance figure are different views of the same share.
Read the chart’s date range and basis before interpreting the line. A price chart shows changes in the share price. A total-return series may also reflect dividends and their reinvestment, so it answers a different question. Comparisons over longer periods also depend on how corporate actions have been treated.
A delayed value remains delayed when a webpage refreshes. Outside market hours, the most recent available trade can legitimately retain its earlier timestamp; a fresh page load does not turn it into a new transaction.

Which Rank Group share is shown?
The London listing identifies the ordinary shares of The Rank Group plc, the UK gambling group with venue and digital businesses.
| Instrument detail | Identification |
|---|---|
| Issuer | The Rank Group plc |
| Security | Ordinary shares of 13 8/9p each |
| Exchange / market | London Stock Exchange, Main Market |
| London ticker | RNK |
| ISIN | GB00B1L5QH97 |
| SEDOL | B1L5QH9 |
| London quote unit | GBX, or pence sterling |
The 13 8/9p description is the share’s nominal value. It is not its current market price. The ISIN helps distinguish the security from a similarly named instrument or a different product referencing it.
Data services may use labels such as LSE:RNK or RNK.L. Those are provider conventions, not separate companies. A CFD or spread-betting price is a quote for a derivative product; it should not be substituted for the ordinary-share quote simply because it uses Rank’s name or ticker.

How to read the quoted price
100 GBX equals £1. For a purely hypothetical example, a price of 90 GBX means £0.90 per share, not £90. A provider using pounds rather than pence will therefore display a different numerical value for the same price. Conversion is needed once, with the resulting unit clearly labelled.
The field label also changes the meaning of the number:
| Field | Meaning |
|---|---|
| Last trade | The price of the most recent reported transaction covered by the source |
| Previous close | The source’s closing-price reference for the preceding session |
| Bid | The price buyers are offering to pay; commonly shown as the price available to someone selling |
| Offer / ask | The price sellers are asking; commonly shown as the price available to someone buying |
| Daily change | Movement against the stated reference price, usually the previous close |
Bid and offer need not equal the last trade. They also do not guarantee an executable price for every order size. A difference between two websites can reflect different fields, timestamps or data coverage rather than an error in the arithmetic.
Daily change is the quoted price minus the relevant previous close. Percentage change divides that difference by the previous close and multiplies by 100. Both prices must use the same unit, and the closing reference must match the session being compared.
Check the market date, time, timezone and delay together. London uses GMT in winter and BST in summer; in November the London timezone is GMT. A provider’s page-update time is distinct from the timestamp of the market observation. AJ Bell’s public RNK factsheet, for example, labels prices as delayed by at least 15 minutes; that statement describes its service, not every RNK quote elsewhere.
Missing values should not be read as zero. An unchanged price may reflect no new observation, a closed market or stale data. Those cases need different explanations, and a failed data request does not establish that the share has lost its value.

Market capitalisation and dividend context
Market capitalisation combines a share price with a share count. The price must be in pounds when the result is expressed in pounds: a GBX price requires division by 100. A share count also needs its own date and definition. In formula form: market capitalisation (£) = price (GBX) ÷ 100 × shares outstanding.
Rank’s AGM announcement reported 468,429,541 ordinary shares in issue on 8 October 2026. This is a dated issued-capital figure, distinct from free float or a particular shareholder’s voting interest. Combining it with an unrelated old quote would not establish current market capitalisation.
The FY2026 final dividend provides a dated event rather than a forecast:
| Dividend detail | FY2026 final event |
|---|---|
| Amount | 2.50p per ordinary share, equivalent to £0.025 |
| Shareholder approval | 8 October 2026 AGM |
| Ex-dividend date | 17 September 2026 |
| Record date | 18 September 2026 |
| Published payment date | 23 October 2026 |
The final dividend was approved at the AGM. The payment date above is the published timetable for that historical event; it is not a promise of the next distribution. Rank’s FY2026 interim dividend was 1.00p per share, paid on 13 March 2026. Together, the interim and final amounts total 3.50p for the financial year.
A dividend yield needs a defined dividend period and a compatible share price. Trailing, forward and annualised yields can differ. The record date identifies the relevant register, while the ex-dividend date concerns trading without entitlement to that distribution. Neither a past payment nor a calculated yield guarantees future income.

What the share price does not tell you
A market price is an observation, not an assessment of every part of Rank’s business. We treat an analyst target as an opinion with a date, horizon and assumptions. It is not the price at which the share trades or a commitment that it will reach that level.
The chart also cannot establish why a price moved. A company announcement and a movement on the same day do not, by themselves, prove causation. Trading conditions, expectations and other information may also matter.
Financial results explain reported performance; shareholder disclosures address ownership and control; regulatory announcements address particular risks and events. Those questions require their own evidence rather than an inference from the shape of the chart. This material explains market information and does not provide a personal investment recommendation.
Source note: listing identity was checked against London Stock Exchange information. Capital and dividend details use Rank’s disclosures, with the ex-dividend date cross-checked against AJ Bell’s event table. The research date records our editorial checking, not a market timestamp. No changing dealing price, market capitalisation or current dividend yield is fixed in this explanatory text.